Calculate greenhouse gas sources easily
"GHG-Calculator Biogas" is a web-based tool for assessing the greenhouse gas (GHG) emissions from various sources along the biogas production in agriculture. Hereby, the GHG emissions from the supply of energy crops can be calculated for average conditions in Germany, or based on regional conditions for Bavarian counties.
The agricultural biogas chain is divided into the sections of substrate supply (cultivation, harvest, transport, storage) and the biogas plant itself, including the co-generation unit for utilizing the biogas (optional: Additional electricity generation from off-heat). "GHG-Calculator" quantifies all relevant streams of GHG emissions along the biogas process chain (see figure).
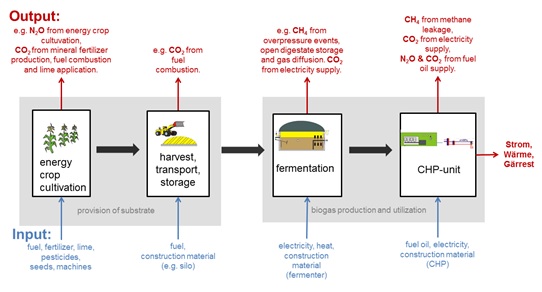
Sketch of material input and GHG output flows along the biogas chain.
Greenhouse Gas (GHG) calculator
Use the "GHG-Calculator" to calculate the share of individual GHG sources and to assess the potential for mitigation: Greenhouse Gas (GHG) calculator
Example profiles
The largest single source of GHG emissions is methane slip, which is conservatively estimated here at 1.5% of total methane produced. At a methane slip of 1.0%, which can be easily achieved by modern, regularly maintained engines, this would reduce total CO2 equivalent emissions by nearly 10% in this example profile. In contrast, complete elimination of methane in the exhaust gas of reciprocating engines is only possible with very great technical effort.
Compared to the marginal electricity mix, the specific GHG emissions for electricity feed-in from this biogas plant are about 80 % lower. The specific GHG emissions of the heat actually used are about 10 % lower than for heat from natural gas at the given high heat utilization rate of about 70 %.
In any case, this example brings the biogas plant to the forefront as a source of GHG emissions. The most effective measure here would be to equip the digestate storage facility with a gas-tight cover and gas collection: this could prevent more than a quarter of the GHG emissions altogether. In this constellation, special attention must be paid to the management of the digestate, as it contains a lot of nitrogen and therefore there is a high risk of nitrogen losses during storage and application.
Compared to the marginal electricity mix, the specific GHG emissions for electricity feed-in from this biogas plant are almost 80% lower. The specific GHG emissions for heat are arithmetically very high for this plant in its current state, since only about one fifth of the heat is used; if the heat utilization rate were increased to 70 %, these could be reduced by about 80 %.
background information
Please, refer to the background information to learn how the input data is evaluated in the GHG-Calculator.
Due to substantial, methodological uncertainties, high expenditure for data acquisition and the lacking availability of reliable data from users or models, the accounting for changes of humus and land use change have not been integrated in the model. As high amounts of emissions and ongoing, intense discussion emanate from the topics humus balance, indirect and direct land use change, a short introduction is given.